Greenplum是全球首个开源MPP数据库,内核基于PostgreSQL。目前迭代迅速,内核已经由PostgreSQL 8.2升级到了9.x。随着这款数据库在国际国内的大规模推广,企业级用户越来越多的将Greenplum选用为大数据分析平台。作为一款企业级数据库,监控是必不可少的一环。商业版本的Greenplum提供商业组件GPCC,用来对Greenplum进行监控。但是GPCC是非开源组件,很多开源用户都迫切需要一款开源的类GPCC产品来解决监控的问题。
目前提到监控,最火的当属Prometheus和Grafana的组合了,Prometheus负责监控指标采集及存储,Grafana负责展示,各有所长。很多企业整体IT架构中,也选用该方案作为整体的监控,所以今天给大家分享一下基于Prometheus和Grafana的解决方案。
1. 简介
1.1 Prometheus简介
Prometheus 是由 SoundCloud 开源监控告警解决方案。它有几个重要的概念:
1)Prometheus时序数据库:存储的是时序数据,即按相同时序(相同名称和标签),以时间维度存储连续的数据的集合。
2)PromQL (Prometheus Query Language) :是 Prometheus 自己开发的数据查询 DSL 语言。
3)Exporter:负责数据汇报的程序,不同的Exporter负责不同的业务。其统一命名格式:xx_exporter
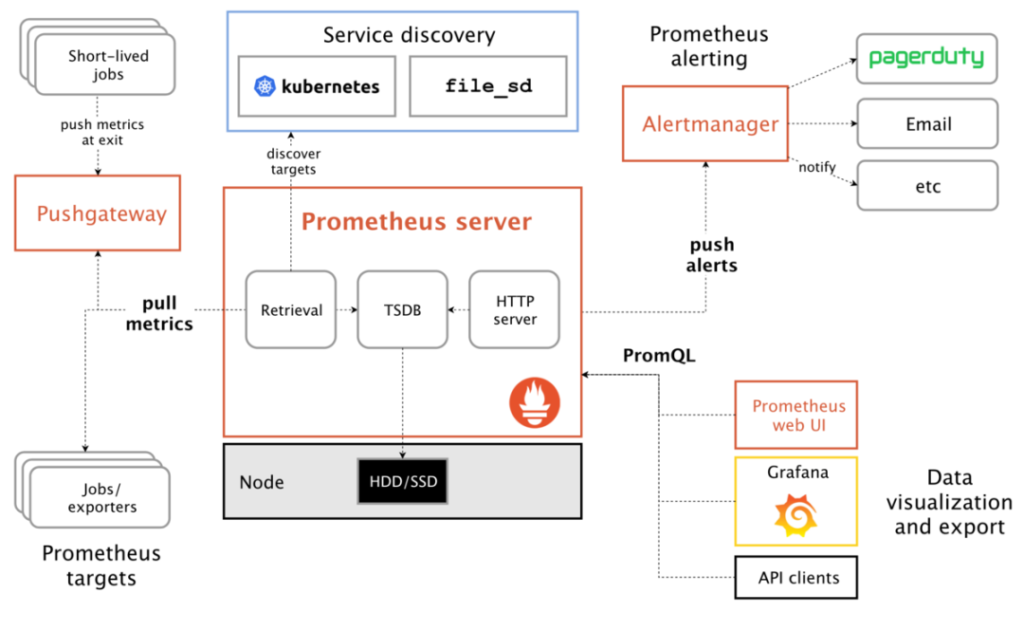
另外从软件部署层面上,仅需部署一个Prometheus Server和对应的Exporter即可完成所需的基本监控功能。
1.2 Grafana简介
Grafana是一个开源的度量分析与可视化套件。经常被用作基础设施的时间序列数据和应用程序分析的可视化,它在其他领域也被广泛的使用包括工业传感器、家庭自动化、天气和过程控制等。
Grafana支持许多不同的数据源。每个数据源都有一个特定的查询编辑器,该编辑器定制的特性和功能是公开的特定数据来源。
官方支持以下数据源:Graphite,InfluxDB,OpenTSDB,Prometheus,Elasticsearch,CloudWatch和KairosDB。
每个数据源的查询语言和能力都是不同的。你可以把来自多个数据源的数据组合到一个仪表板,但每一个面板被绑定到一个特定的数据源,它就属于一个特定的组织。下面我们来一起感受一下Grafana。
2.Greenplum监控的实现
采用本文的方案来实现Greenplum监控特别简单,大体逻辑如下:
- 安装Prometheus;
- 安装Grafana;
- 用Go语言简单开发一个Greenplum Exporter(用来采集Greenplum指标);并启动采集程序;
- 在Prometheus中配置Greenplum Exporter,将采集的指标收集到Prometheus时序数据库中存储;
- 在Grafana中配置数据源为上面的Prometheus,并绘制可视化仪表板。
2.1 Greenplum Exporter的实现
具体项目地址可以fork我的链接:https://github.com/ChrisYuan/greenplum_exporter
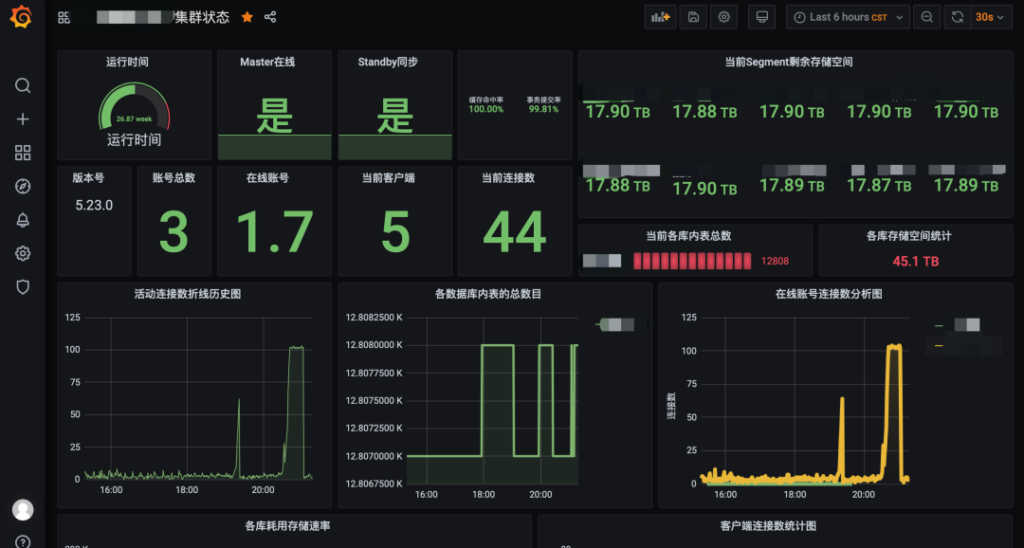
在greenplum_expoter里主要扩展了实现了客户连接信息、账号连接信息、Segment存储信息、集群节点同步状态、数据库锁监控等相关指标,具体指标如下:
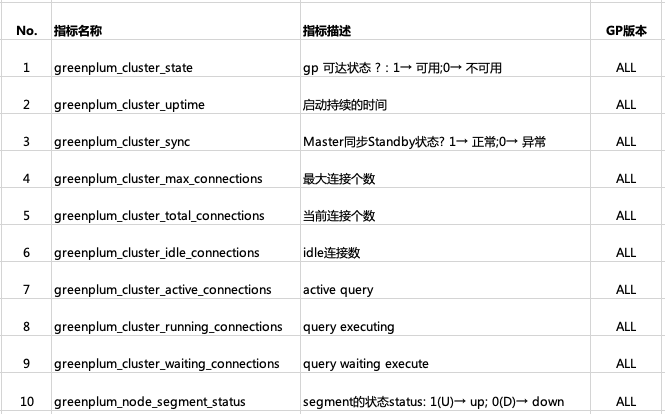
具体指标请参考github上的readme文件。(https://github.com/ChrisYuan/greenplum_exporter/blob/master/README.md)
2.2 Grafana仪表板的实现
根据以上监测指标,即可使用Grafana配置图像了,具体内容请见链接
3 Greenplum监控的安装部署
整个安装部署过程基于第2部分开始的逻辑,并且采用第2部分已经编译好的Exporter。我这里采用家里的群晖NAS进行监控安装操作演示,具体步骤如下:
3.1 Prometheus安装
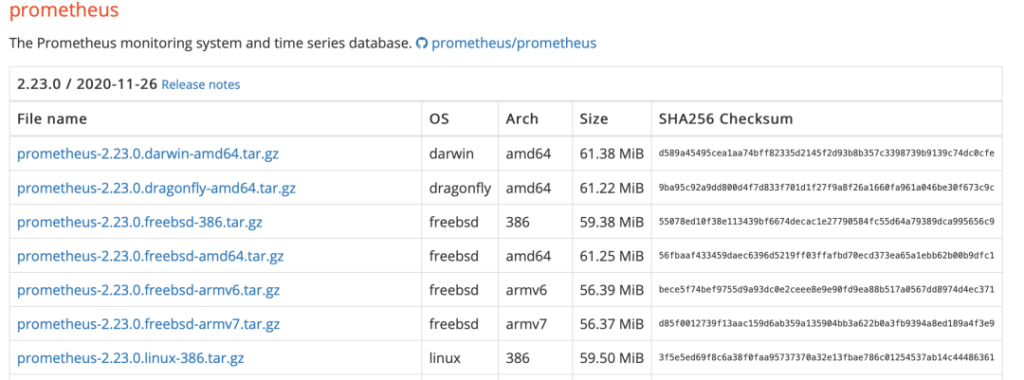
首先从Prometheus官网上下载对应操作系统的Prometheus软件包:https://prometheus.io/download/
下载完成后上传到服务器然后解压缩:
admin@ChrisJenny:~$ tar -xvf prometheus-2.21.0.linux-amd64.tar
admin@ChrisJenny:~/Software$ cd prometheus/
admin@ChrisJenny:~/Software/prometheus$ ls
console_libraries consoles data LICENSE NOTICE prometheus prometheus.yml promtool此时有两种方式启动Prometheus:一是通过直接执行prometheus命令,二是配置为系统systemd等自启动服务。我这里采用简单的直接执行命令的方式,如果您有系统自启动服务配置需求,请参考官方手册的操作方式。
admin@ChrisJenny:~/Software/prometheus$ ./prometheus
level=info ts=2020-12-09T14:32:19.550Z caller=main.go:310 msg="No time or size retention was set so using the default time retention" duration=15d
level=info ts=2020-12-09T14:32:19.550Z caller=main.go:346 msg="Starting Prometheus" version="(version=2.21.0, branch=HEAD, revision=e83ef207b6c2398919b69cd87d2693cfc2fb4127)"
level=info ts=2020-12-09T14:32:19.550Z caller=main.go:347 build_context="(go=go1.15.2, user=root@a4d9bea8479e, date=20200911-11:35:02)"
level=info ts=2020-12-09T14:32:19.550Z caller=main.go:348 host_details="(Linux 4.4.59+ #25426 SMP PREEMPT Wed Jul 8 03:21:29 CST 2020 x86_64 ChrisJenny (none))"
level=info ts=2020-12-09T14:32:19.550Z caller=main.go:349 fd_limits="(soft=1024, hard=4096)"
level=info ts=2020-12-09T14:32:19.550Z caller=main.go:350 vm_limits="(soft=unlimited, hard=unlimited)"
level=info ts=2020-12-09T14:32:19.554Z caller=main.go:701 msg="Starting TSDB ..."
level=info ts=2020-12-09T14:32:19.560Z caller=head.go:644 component=tsdb msg="Replaying on-disk memory mappable chunks if any"
level=info ts=2020-12-09T14:32:19.560Z caller=head.go:658 component=tsdb msg="On-disk memory mappable chunks replay completed" duration=4.93µs
level=info ts=2020-12-09T14:32:19.560Z caller=head.go:664 component=tsdb msg="Replaying WAL, this may take a while"
level=info ts=2020-12-09T14:32:19.560Z caller=web.go:523 component=web msg="Start listening for connections" address=0.0.0.0:9090
level=info ts=2020-12-09T14:32:19.560Z caller=head.go:716 component=tsdb msg="WAL segment loaded" segment=0 maxSegment=1
level=info ts=2020-12-09T14:32:19.562Z caller=head.go:716 component=tsdb msg="WAL segment loaded" segment=1 maxSegment=1
level=info ts=2020-12-09T14:32:19.563Z caller=head.go:719 component=tsdb msg="WAL replay completed" checkpoint_replay_duration=53.566µs wal_replay_duration=2.510703ms total_replay_duration=2.609138ms
level=info ts=2020-12-09T14:32:19.566Z caller=main.go:721 fs_type=9123683e
level=info ts=2020-12-09T14:32:19.566Z caller=main.go:724 msg="TSDB started"
level=info ts=2020-12-09T14:32:19.566Z caller=main.go:850 msg="Loading configuration file" filename=prometheus.yml
level=info ts=2020-12-09T14:32:19.569Z caller=main.go:881 msg="Completed loading of configuration file" filename=prometheus.yml totalDuration=2.807902ms remote_storage=3.439µs web_handler=1.097µs query_engine=1.581µs scrape=1.190738ms scrape_sd=85.464µs notify=60.146µs notify_sd=511.617µs rules=4.706µs
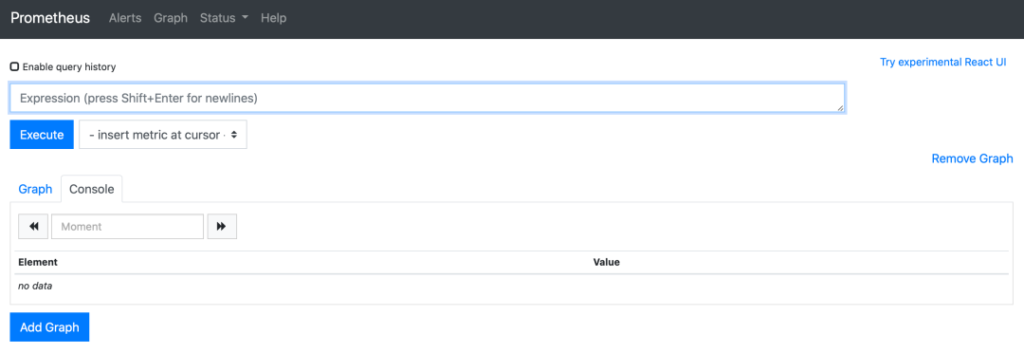
level=info ts=2020-12-09T14:32:19.569Z caller=main.go:673 msg="Server is ready to receive web requests."Prometheus启动后,可以通过IP:9090端口查看是否正常启动并提供服务,如果访问不通,需要关注一下防火墙是否已经开放端口或者关闭。访问通的情况下如下:
3.2 Grafana安装
首先从Grafana官网上下载对应操作系统的Grafana软件包:https://grafana.com/grafana/download
下载完成后上传到服务器然后解压缩:
admin@ChrisJenny:~/Software/grafana$ tar -xvf grafana-7.1.5.linux-amd64.tar
admin@ChrisJenny:~/Software$ mv grafana-7.1.5 grafana
admin@ChrisJenny:~/Software$ cd grafana/
admin@ChrisJenny:~/Software/grafana$ ls
bin  conf  LICENSE  NOTICE.md  plugins-bundled  public  README.md  scripts  VERSION
此时跟上面的Prometheus一样,Grafana也有两种方式启动:一是通过直接执行bin/grafana-server命令,二是配置为系统systemd等自启动服务。我这里采用简单的直接执行命令的方式,如果您有系统自启动服务配置需求,请参考官方手册的操作方式。
admin@ChrisJenny:~/Software/prometheus$ ./grafana-server
......
INFO[12-09|22:47:54] Executing migration logger=migrator id="Add OAuth access token to user_auth"
INFO[12-09|22:47:54] Executing migration logger=migrator id="Add OAuth refresh token to user_auth"
INFO[12-09|22:47:55] Executing migration logger=migrator id="Add OAuth token type to user_auth"
INFO[12-09|22:47:55] Executing migration logger=migrator id="Add OAuth expiry to user_auth"
INFO[12-09|22:47:55] Executing migration logger=migrator id="Add index to user_id column in user_auth"
INFO[12-09|22:47:55] Executing migration logger=migrator id="create server_lock table"
INFO[12-09|22:47:55] Executing migration logger=migrator id="add index server_lock.operation_uid"
INFO[12-09|22:47:55] Executing migration logger=migrator id="create user auth token table"
INFO[12-09|22:47:56] Executing migration logger=migrator id="add unique index user_auth_token.auth_token"
INFO[12-09|22:47:56] Executing migration logger=migrator id="add unique index user_auth_token.prev_auth_token"
INFO[12-09|22:47:56] Executing migration logger=migrator id="create cache_data table"
INFO[12-09|22:47:56] Executing migration logger=migrator id="add unique index cache_data.cache_key"
INFO[12-09|22:47:57] Created default admin logger=sqlstore user=admin
INFO[12-09|22:47:57] Starting plugin search logger=plugins
INFO[12-09|22:47:57] Registering plugin logger=plugins name="Direct Input"
INFO[12-09|22:47:57] External plugins directory created logger=plugins directory=/var/services/homes/admin/Software/grafana/data/plugins
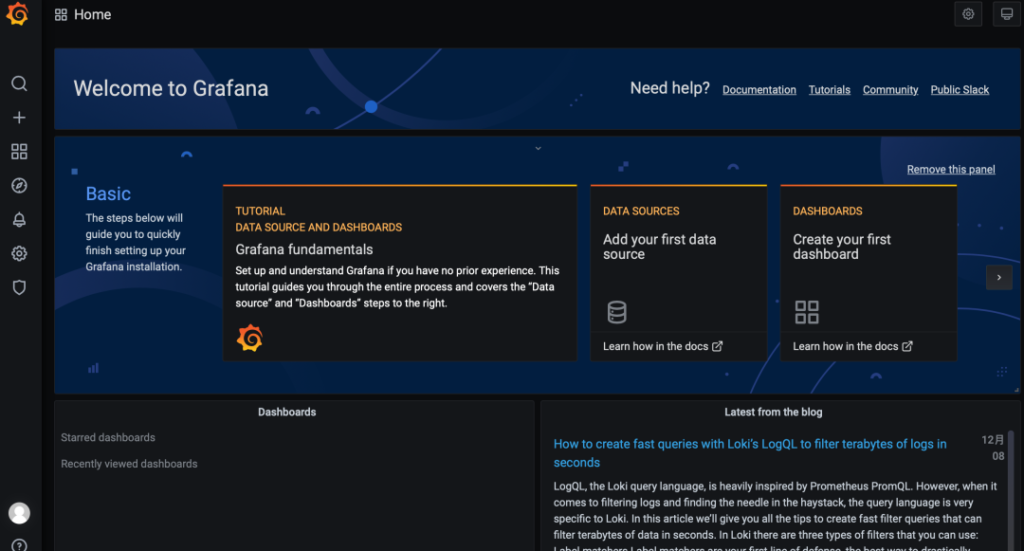
INFO[12-09|22:47:57] HTTP Server Listen logger=http.server address=[::]:3000 protocol=http subUrl= socket=Grafana启动后,可以通过IP:3000端口查看是否正常启动并提供服务,如果访问不通,需要关注一下防火墙是否已经开放端口或者关闭。访问通的情况下如下:
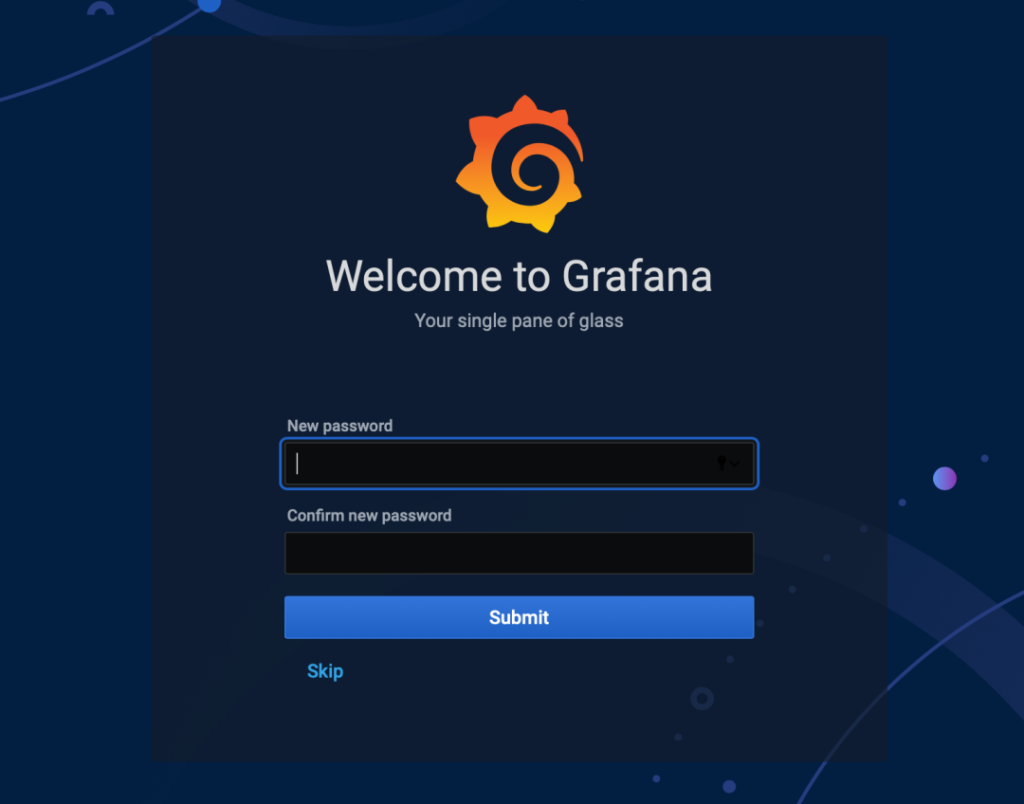
登录到Grafana界面后,首先输入默认用户名和密码,这里默认均是admin,然后下一步修改一个新的密码。重新登录后如下图,表示配置成功:
3.3 配置Greenplum Exporter启动并采集Greenplum指标数据
从https://github.com/ChrisYuan/greenplum_exporter下载源码编译或直接下载release
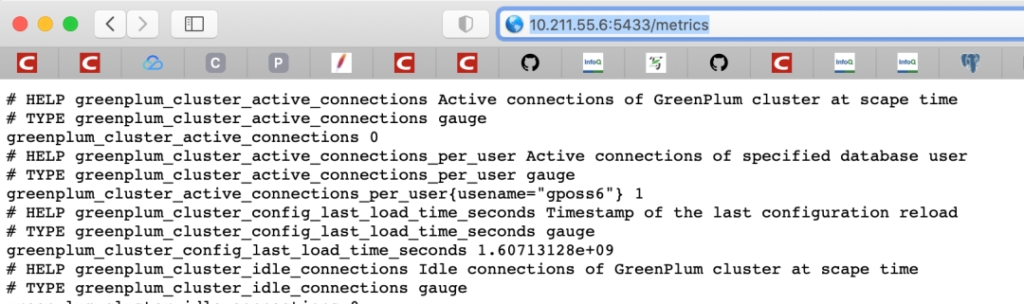
[parallels@centos7 bin]$ export GPDB_DATA_SOURCE_URL=postgres://gposs6:gposs6@127.0.0.1:5432/postgres?sslmode=disable
[parallels@centos7 bin]$ ./greenplum_exporter --web.listen-address="0.0.0.0:5433" --web.telemetry-path="/metrics" --log.level=error --greenplumVersion=gposs6
启动后,访问ip:5433查看指标采集是否成功,如下信息代表采集成功:
3.4 在Prometheus中配置Greenplum Exporter
打开prometheus.yml文件(在prometheus文件夹下)在尾部增加如下内容:
备注:如果您是第一次接触yml文件,请注意在编辑器中对prometheus.yml的格式进行严格的校验,否则多余的空格或Tab键可能影响Prometheus的采集。
  - job_name: 'greenplum'
    static_configs:
    - targets: ['110.211.55.6:5433']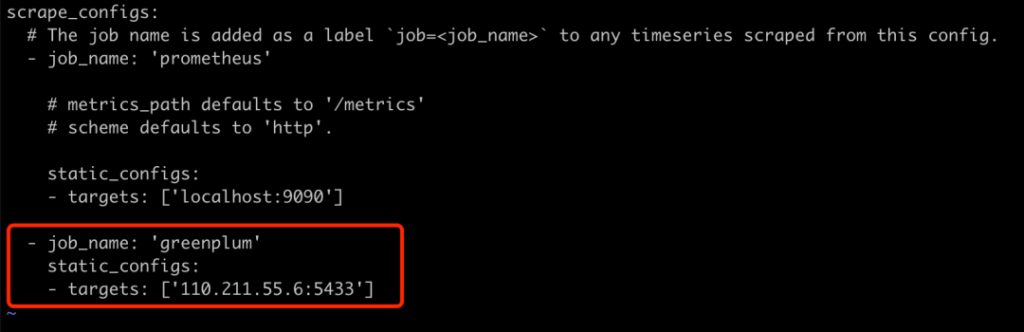
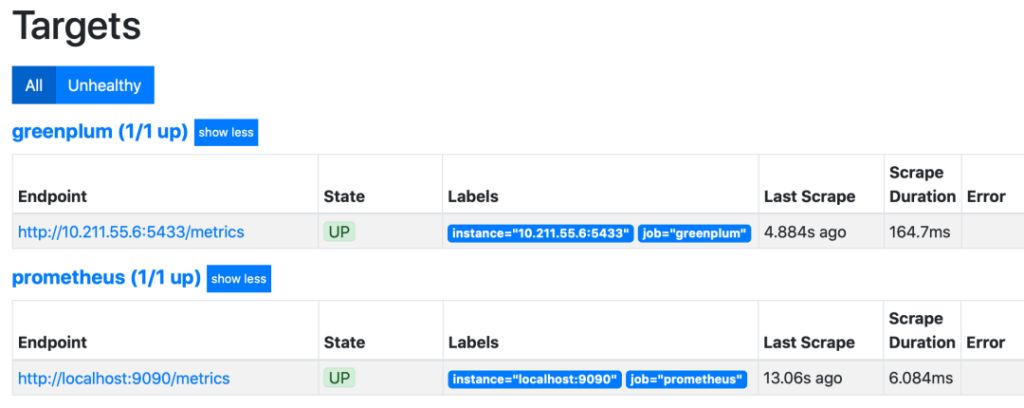
重启Prometheus服务:
admin@ChrisJenny:~/Software/prometheus$ ps -ef | grep prometheus
admin     3773  2451  0 06:47 pts/13   00:00:00 grep --color=auto prometheus
admin    13155     1  0 Dec09 ?        00:01:25 ./prometheus
admin@ChrisJenny:~/Software/prometheus$ kill -9 13155
admin@ChrisJenny:~/Software/prometheus$ nohup ./prometheus &
查看prometheus web端是否能正常获取监控指标:
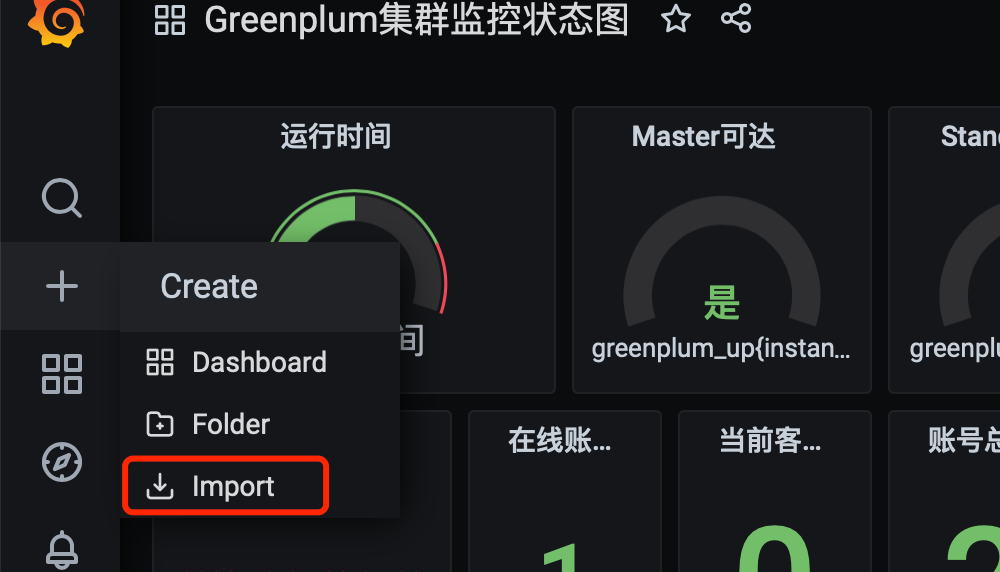
3.5 在Grafana中配置Prometheus数据源,并绘制/导入可视化仪表板
登录到Grafana:http://192.168.0.200:3000
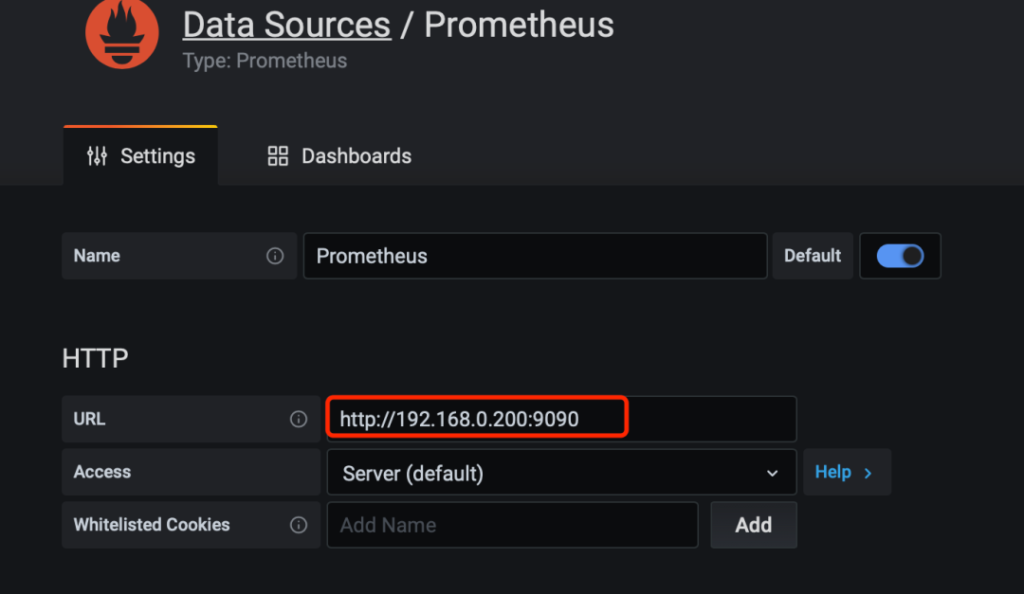
选择Prometheus为数据源:
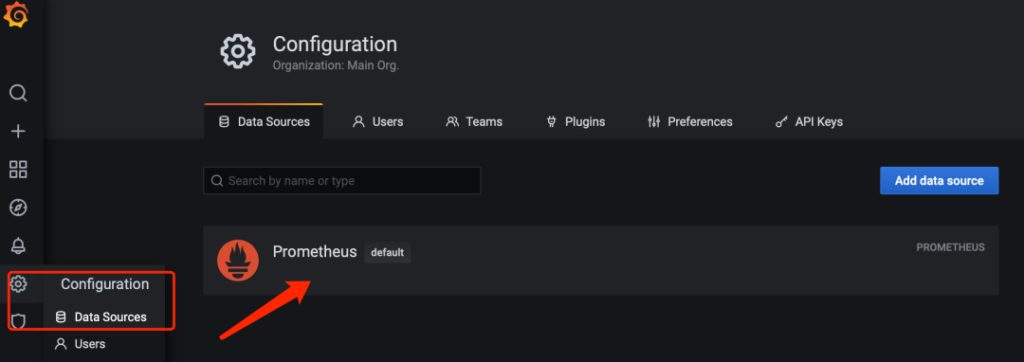
配置Prometheus的IP和端口:
导入项目中提供的json即可:https://github.com/ChrisYuan/greenplum_exporter/blob/master/grafana/greenplum_dashboard.json
4. 写在最后
本文给大家展开介绍了一种基于Prometheus及Grafana的解决方案,该方案具有以下优势:
- 软件安装简捷、无太多繁琐步骤,基本都是一件启动和一键配置;
- 符合目前主流的监控方式,可以与大部分企业已有的Prometheus监控进行集成;
- 针对Greenplum各个版本的监控做了统一适配的Exporter,不需要每个版本采用单独的监控组件;
- 免费开源,可以继续进行二次开发;
如果大家对我带来的解决方案有任何问题,可以在添加微信助手(gp_assistant)加入Greenplum官方社区微信群或Askgp(cn.greenplum.org/askgp) 留言交流,也欢迎大家把自己关心的指标提交更新到greenplum_exporter的github中,一起来完善这款插件。
作者介绍
苑泽福(阿福),Greenplum中文社区成员,山东辉鸿泛在电子科技有限公司技术总监。
有十多年的从业经验,曾供职于鼎兴达、瀚高,拥有丰富的数据库开发运维经验,近年来一直专注于Greenplum数据库,主导并完成了多个基于Greenplum的数据平台落地。目前专注于物联网产品研发,处于创业阶段。